Your dashboard opens every time you sign in. It shows the whole team unless you narrow it to one territory or one rep.
Your sales dashboard1:33 · narrated, with captions
Transcript
This video covers your home dashboard in Cabeau Hub, the first screen you see as VP of Sales.
The greeting line tells you the week, how many active B2B accounts there are, and how many ordered in the last ninety days.
The search bar finds customers, leads, orders and invoices from one place.
The shortcut row opens the pipeline, customers, sales orders, inventory, invoices, payments, activities, your agenda, the forecast and meeting transcripts.
Four headline numbers follow: revenue this year against last year, open pipeline, accounts active in the last ninety days, and team follow-ups due today.
Use the territory filter at the top right to narrow every figure on the page to one territory.
Revenue by channel splits this year's revenue across travel retail, mixed and mass.
Timing and accountability shows how quickly the team responds, measured in business hours, follow-up compliance, and how long deals take. Pick one rep to see their numbers alone.
Further down, open orders lists the largest orders still open, with the customer and how long each has been open. Open all shows the complete list.
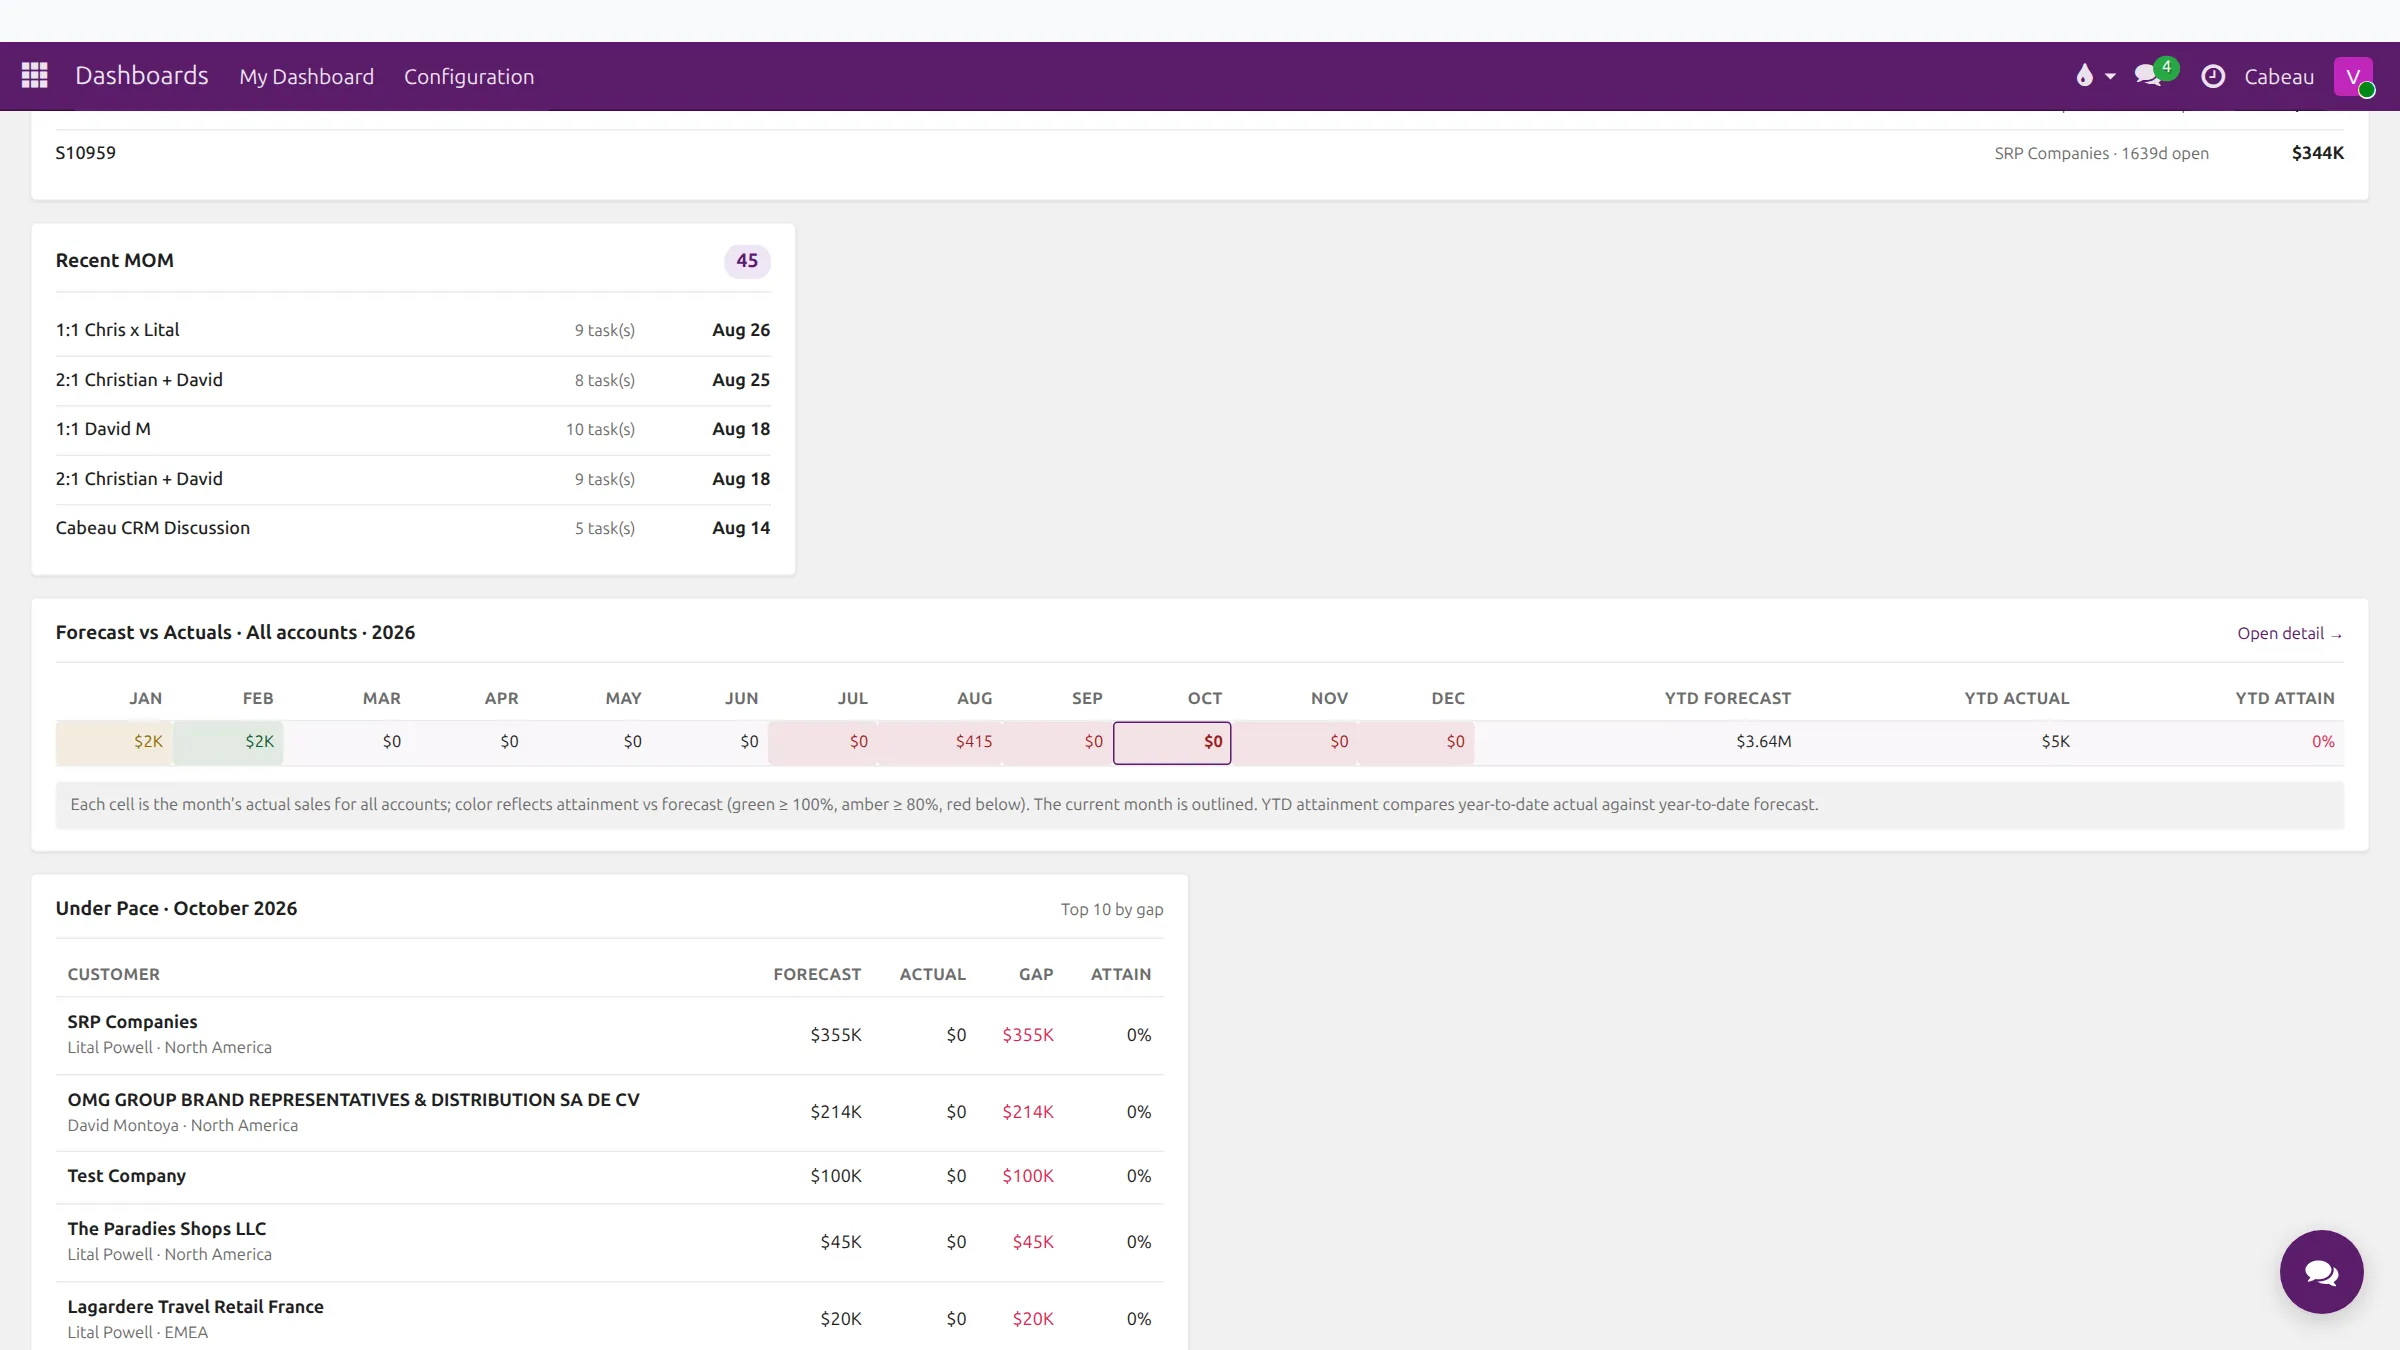
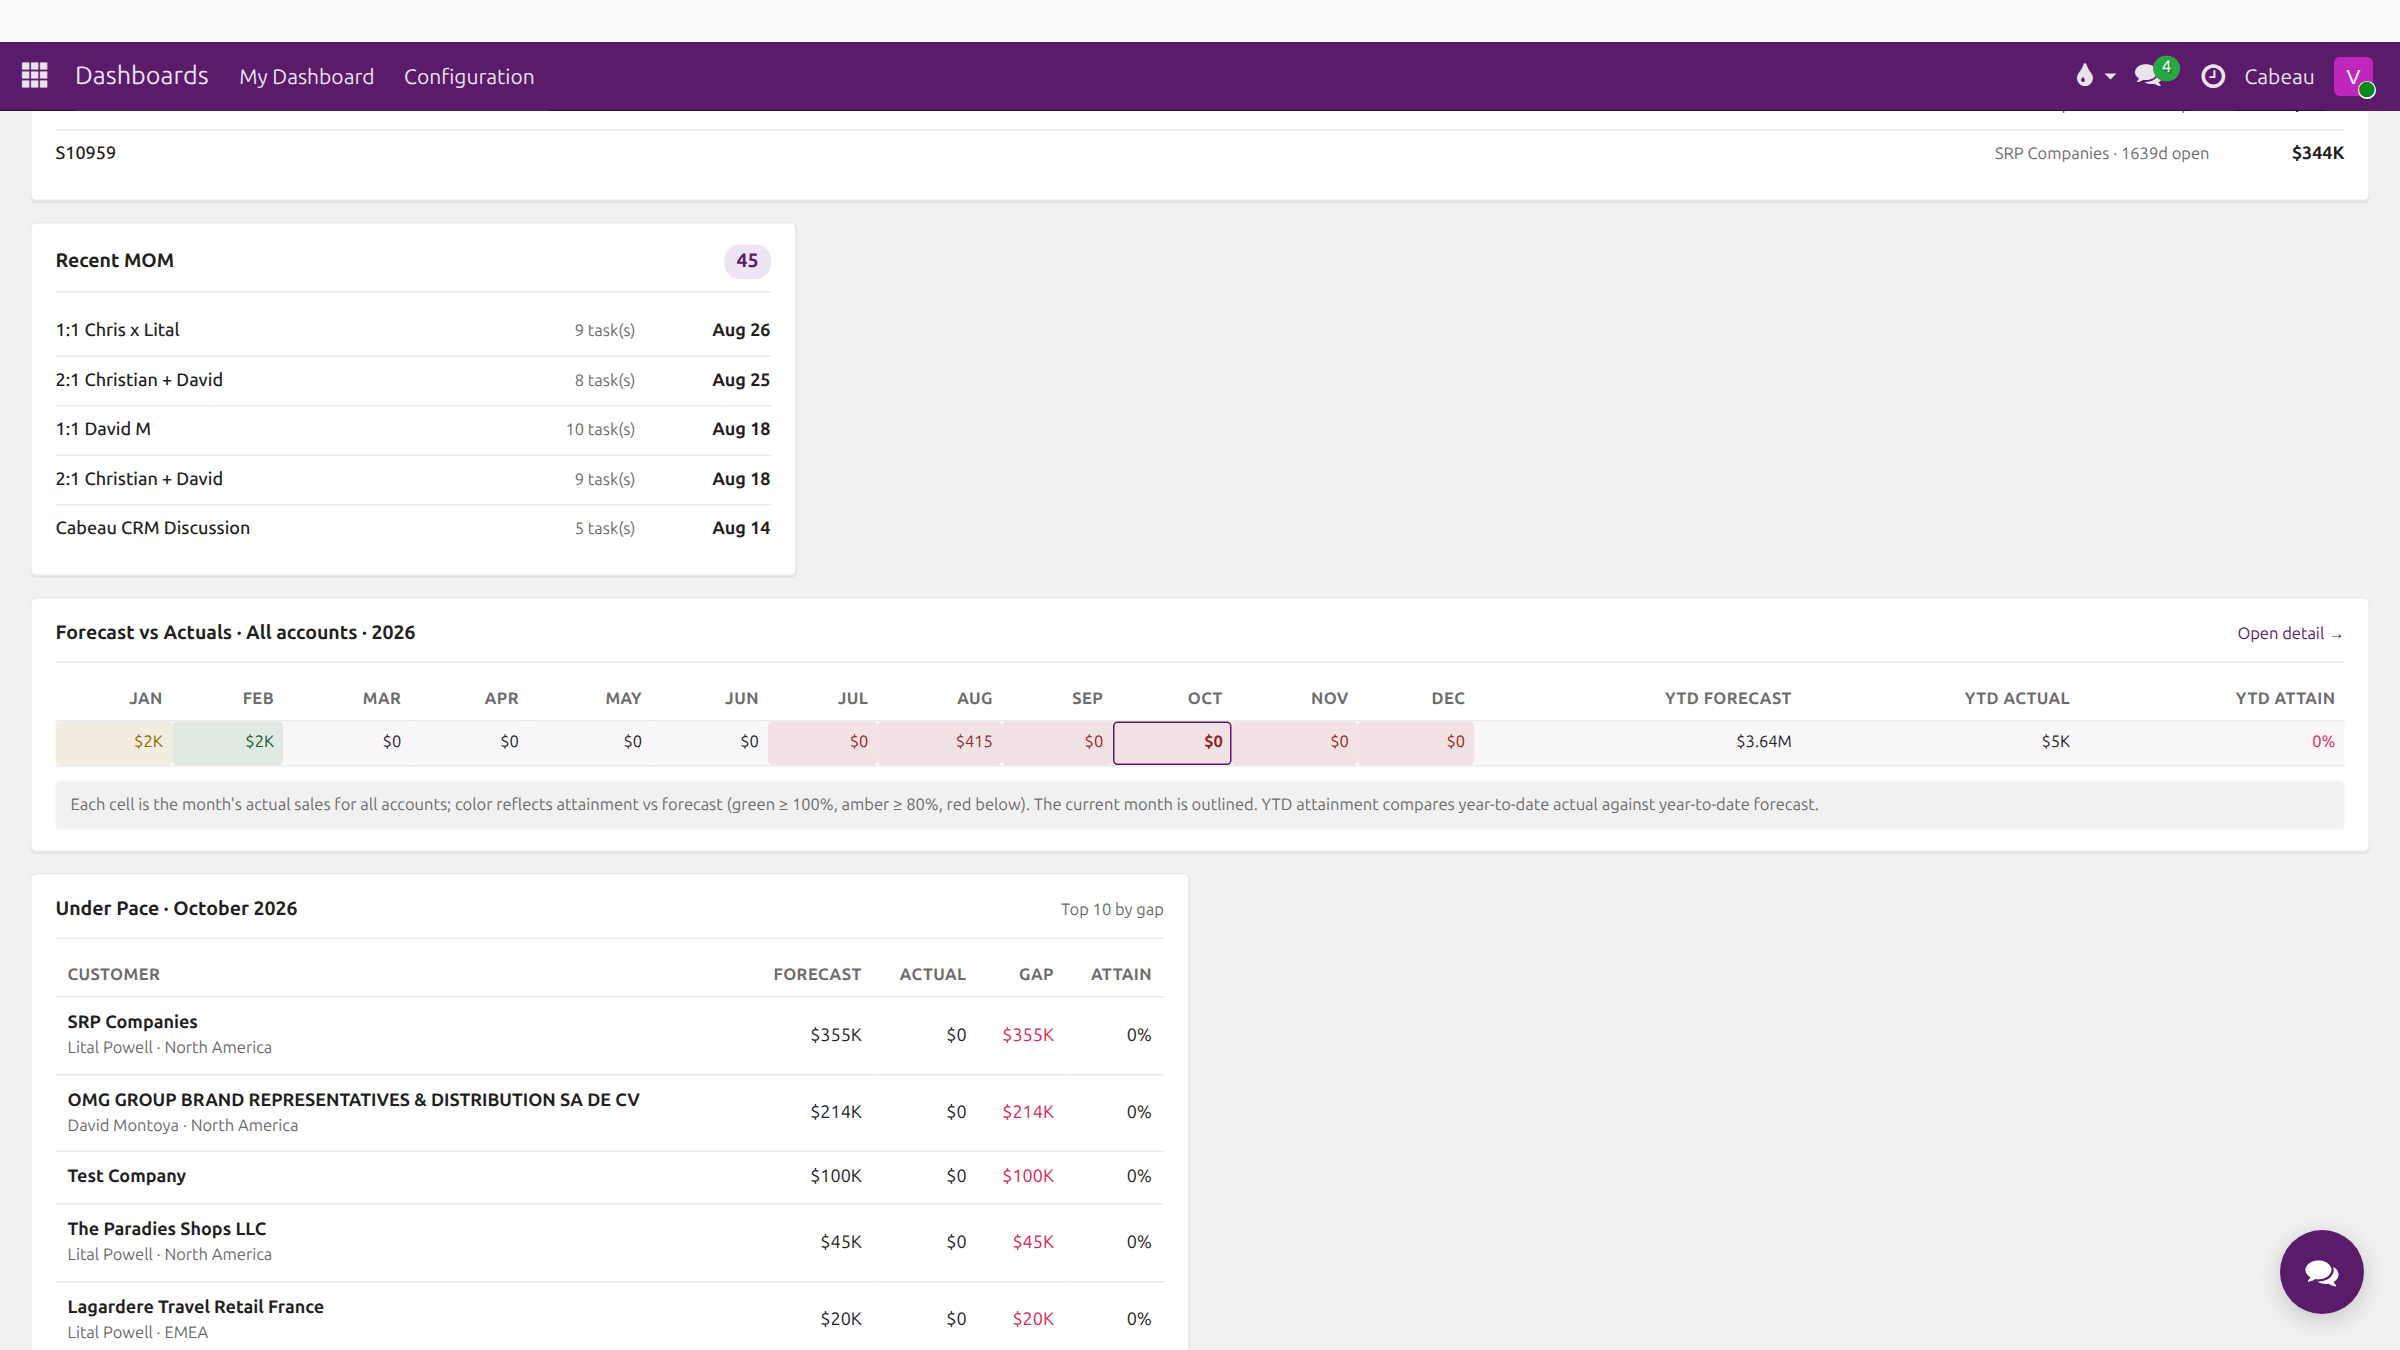
Recent minutes of meeting lists the meetings summarised by the Hub, with their tasks.
That is your dashboard. Next, drilling into territories and channels.
Greeting line: the current week, the number of active B2B accounts, and how many ordered in the last 90 days.
Search bar: finds customers, leads, orders and invoices from one box.
Shortcut row: Pipeline, Customers, Sales Orders, Inventory, Invoices, Payments, Activities, Agenda, Forecast and Transcripts, then + Customer (green) to create a customer, Territory x Channel and Apollo.
Territory filter (top right): All Territories, North America, LATAM, EMEA, APAC, Corporate or NAM. Every figure on the page follows it.
Revenue by Channel (YTD) splits this year’s revenue into Travel Retail, Mixed, Mass and Unassigned.
Timing and Accountability shows business-hours turnaround, follow-up compliance, average days in Proposal and average deal cycle for key accounts. Turnaround is measured in business hours in each rep’s local timezone, on the Cabeau Business Hours calendar (Monday to Friday, 09:00 to 18:00 PST).
Use the All Reps selector on that panel to see one rep’s numbers on their own.
Open Orders: the five largest open orders with customer, days open and amount. Open all lists every open order.
Recent MOM: meetings the Hub has summarised, with the number of tasks and the date.
Forecast vs Actuals: the year by month, with year-to-date forecast, actual and attainment. Green is at or above 100 per cent, amber 80 to 99 per cent, red below 80.
Under Pace: the ten customers furthest behind their forecast this month, with forecast, actual, gap and attainment.