Dashboard
Account Manager
Your account dashboard 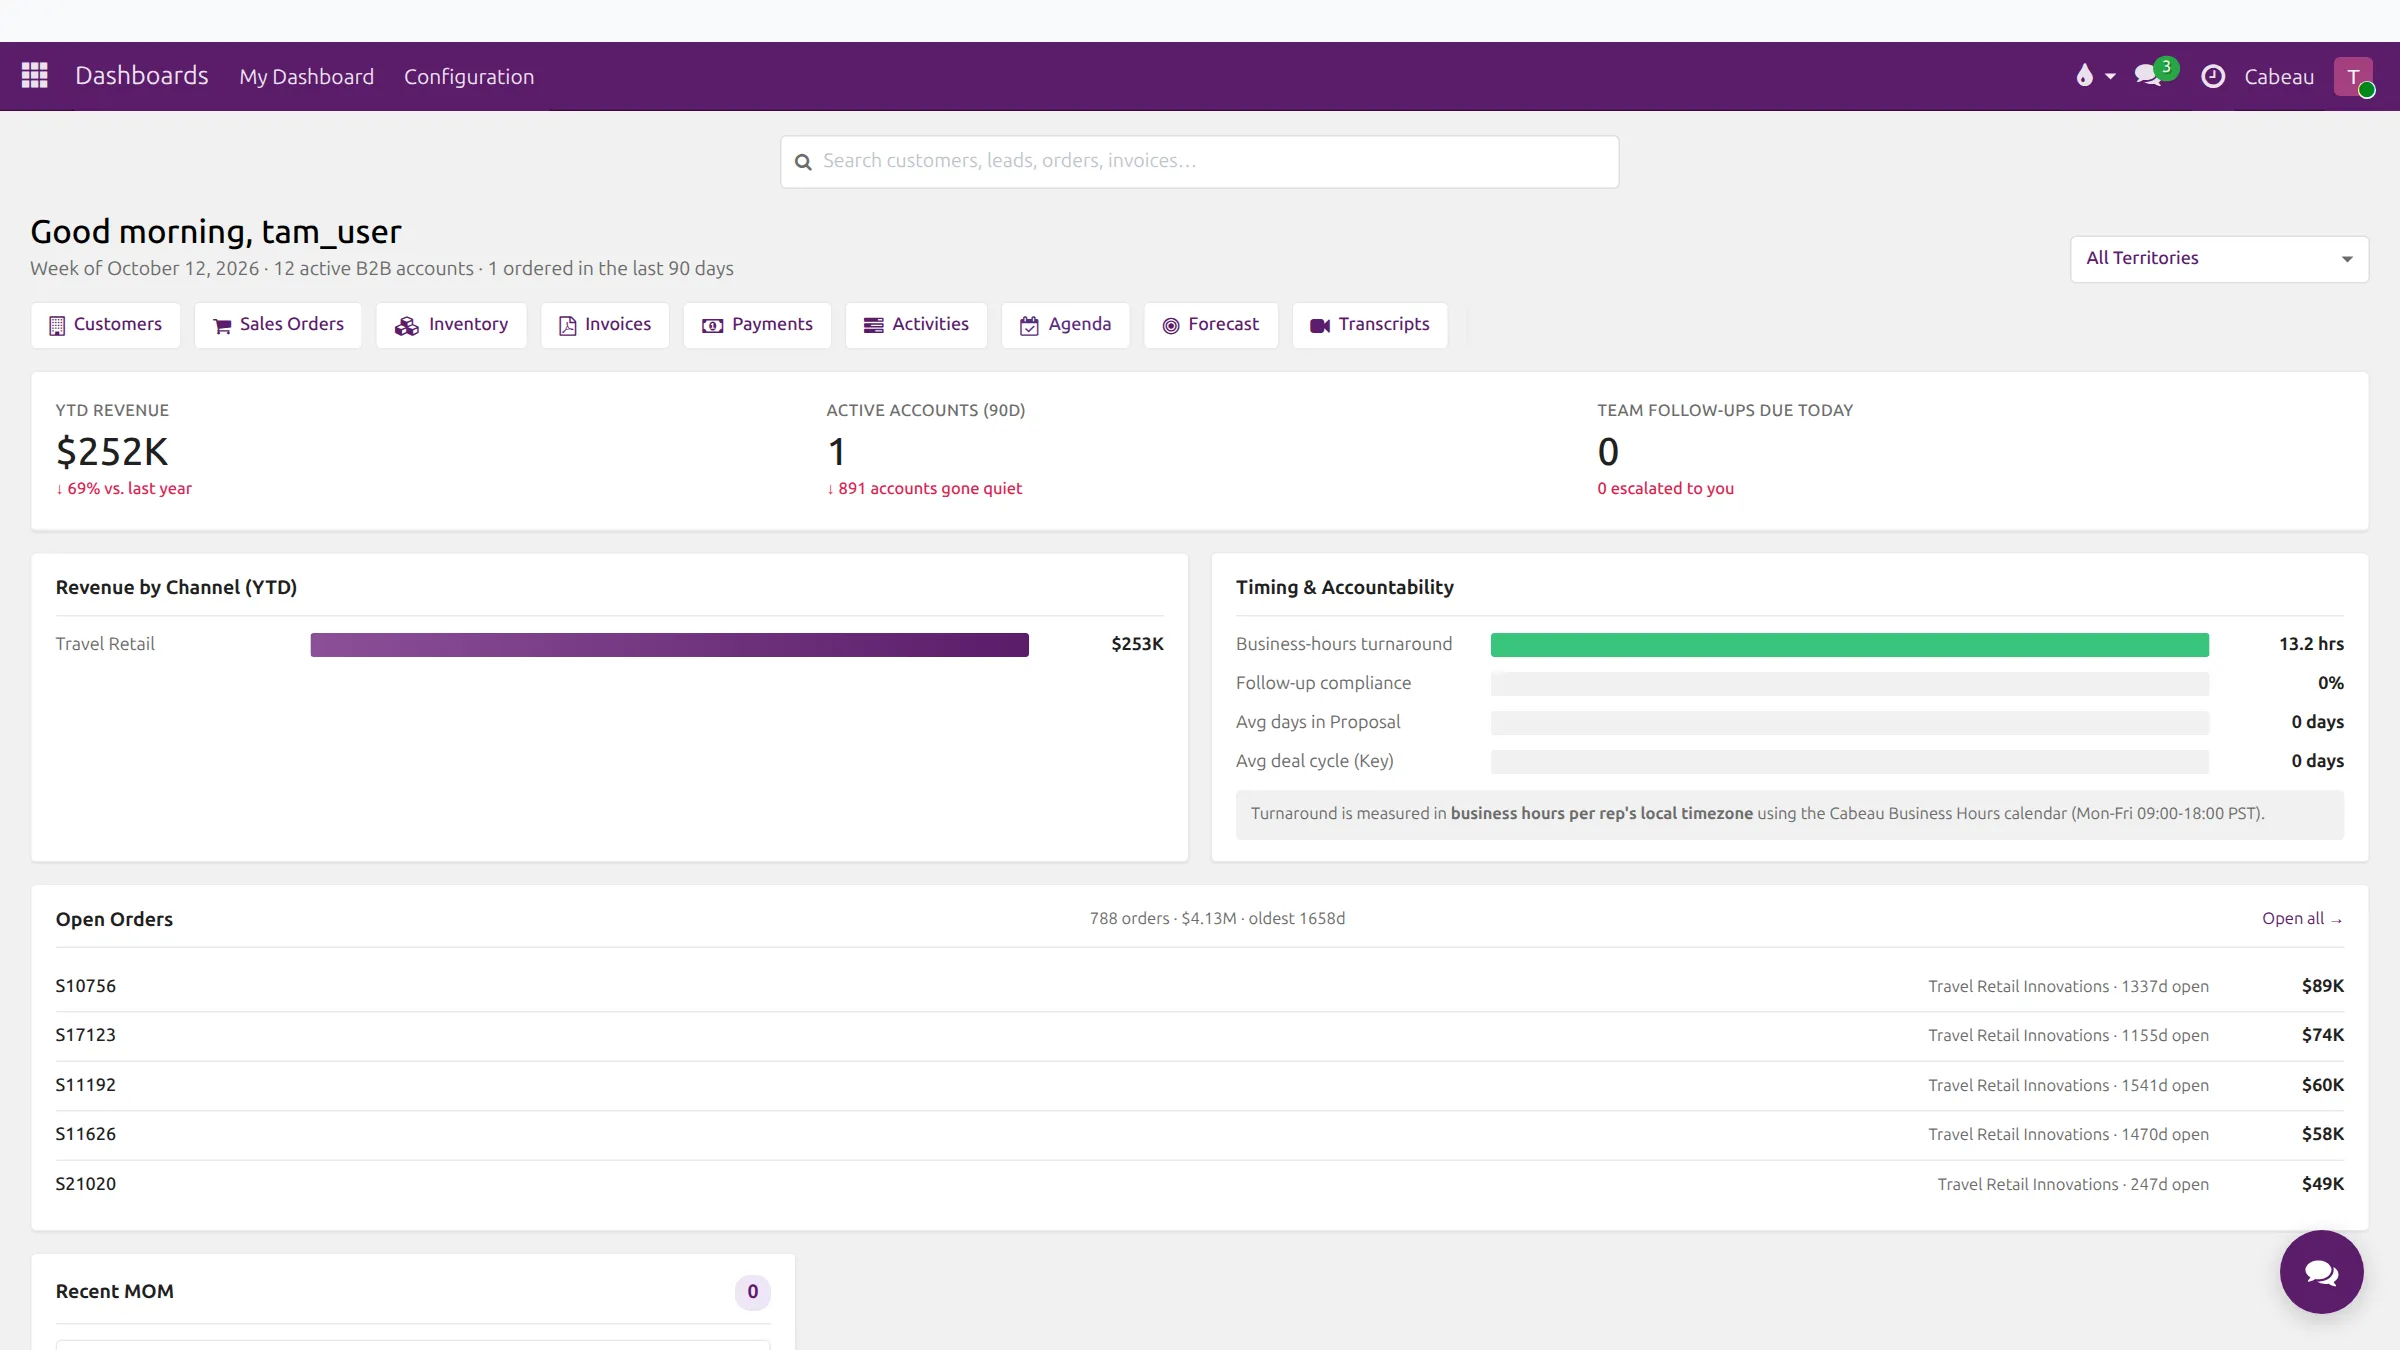
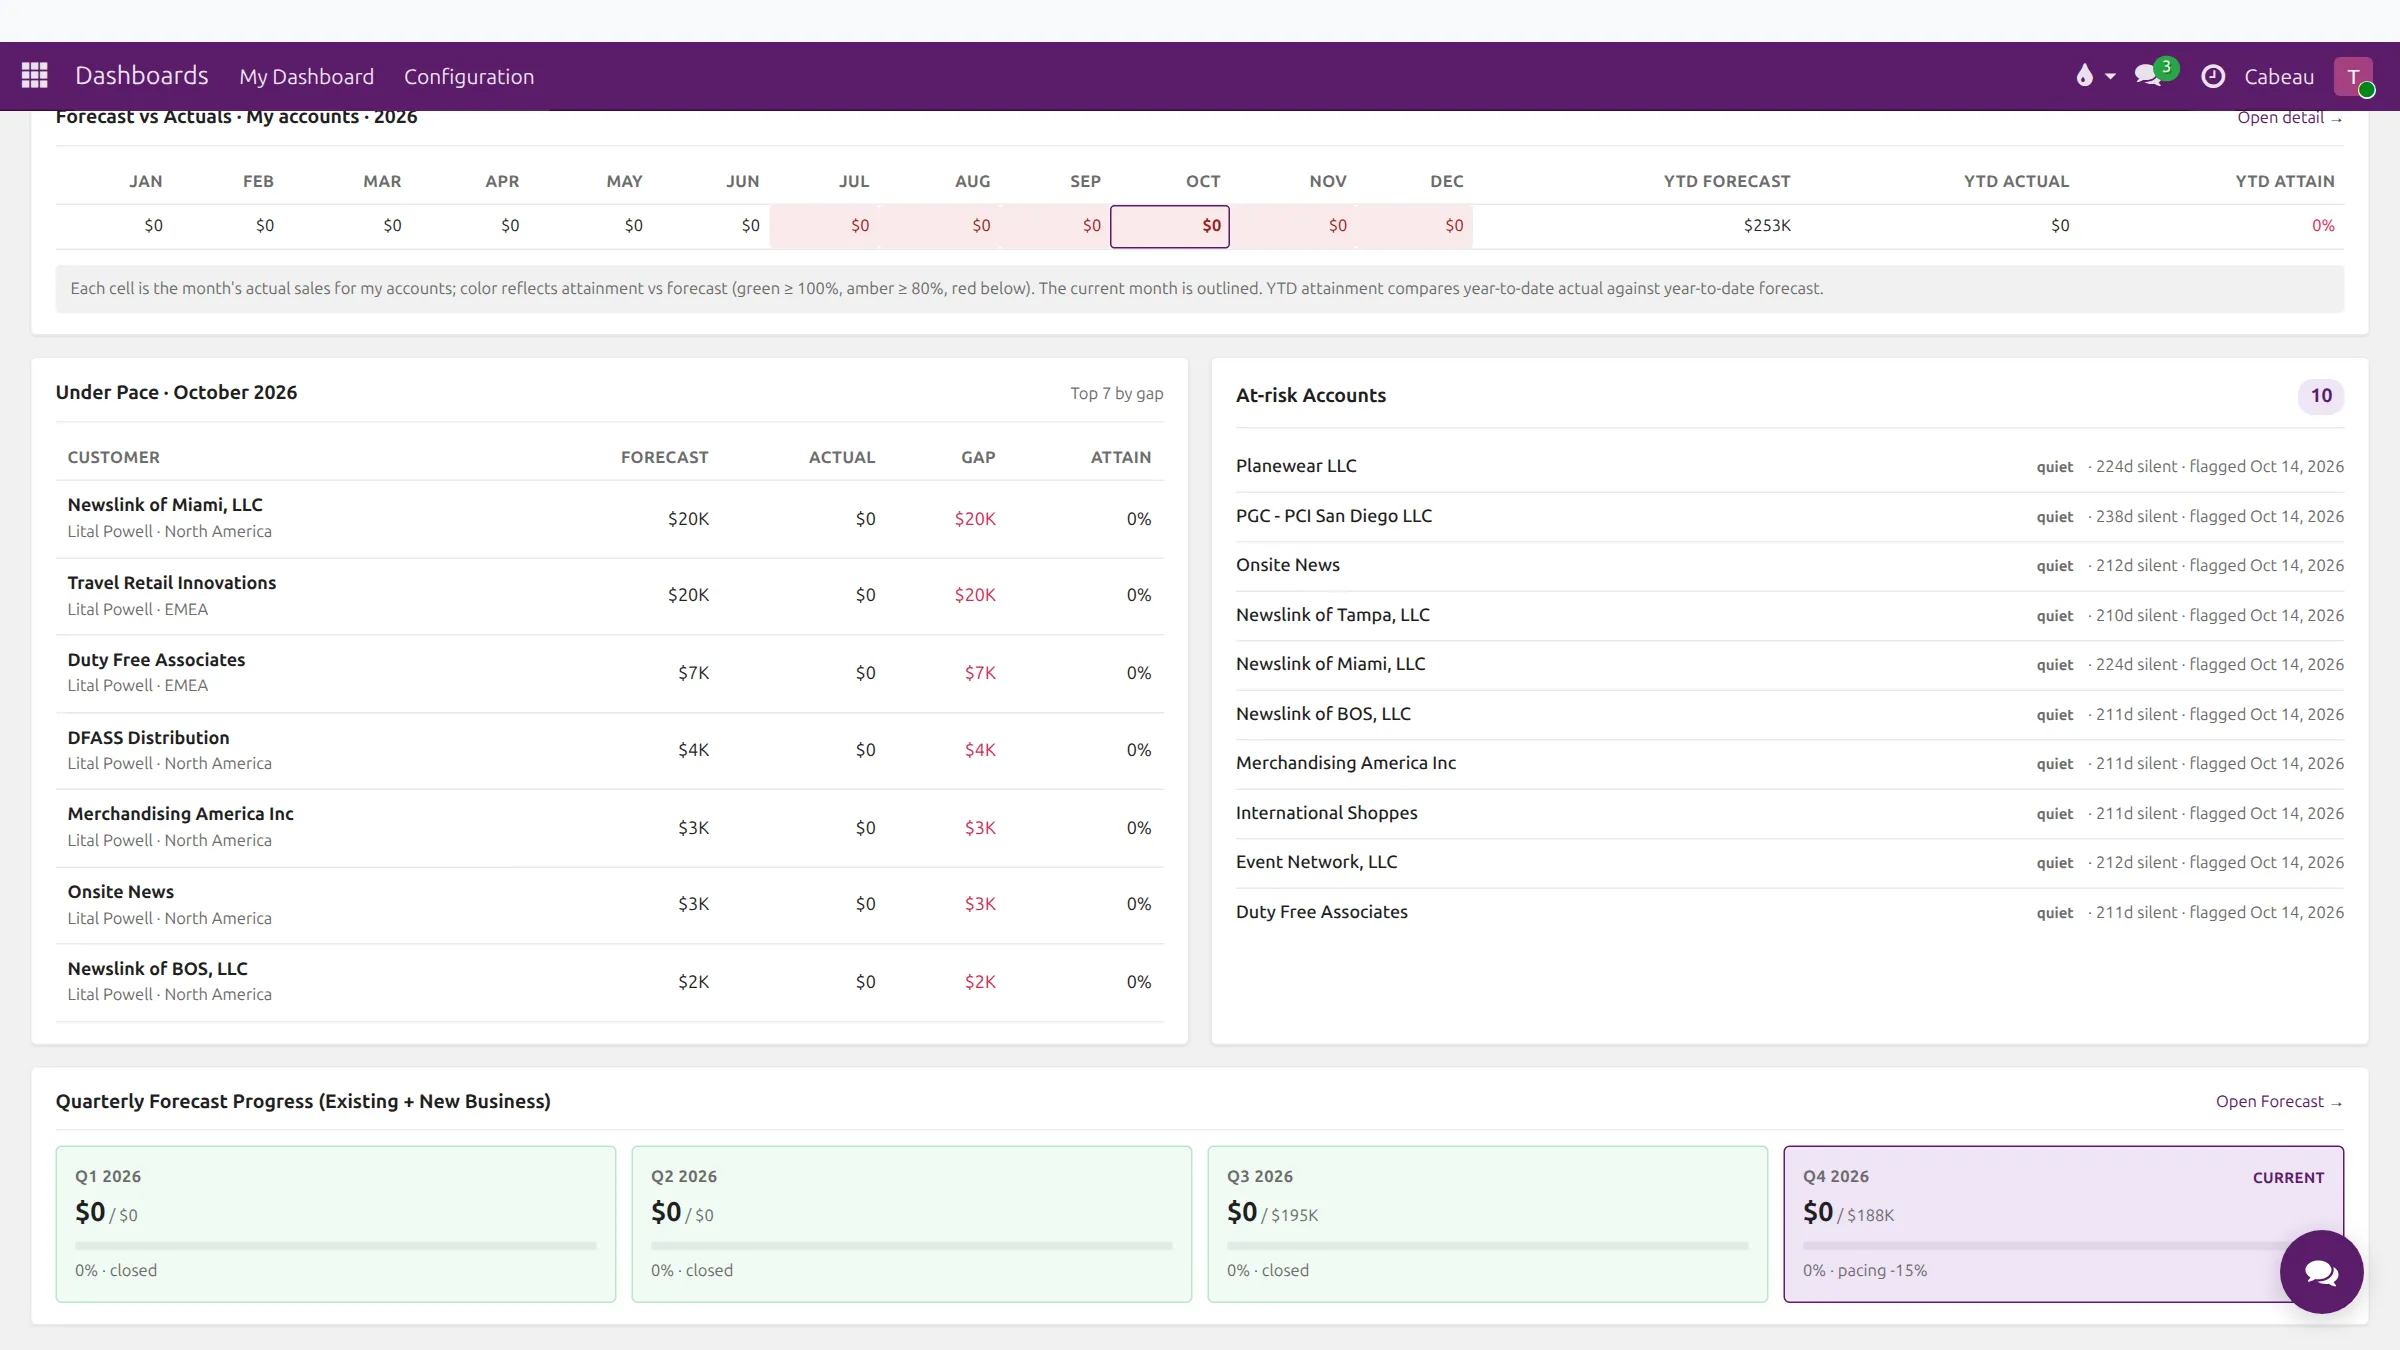
Your dashboard opens when you sign in. Every figure on it covers the accounts where you are the primary or secondary Account Manager.
Transcript
- This video covers your home dashboard as an Account Manager. Every figure on it covers the accounts you manage.
- The greeting line counts your active B2B accounts, and how many of them ordered in the last ninety days.
- The search bar finds your customers, orders and invoices from one place.
- The shortcut row opens your customers, sales orders, inventory, invoices, payments, activities, the forecast and meeting transcripts.
- Three headline numbers follow: your revenue this year against last year, your active accounts, and follow-ups due today.
- Revenue by channel splits your revenue this year by sales channel. Timing and accountability shows how quickly you respond, in business hours.
- Use the territory filter at the top right to narrow the page to one territory.
- Open orders lists the largest orders still open on your accounts, with the customer and how long each has been open.
- Further down, forecast against actuals shows each month of the year, colour coded by how close your accounts are to forecast.
- Under pace lists the customers furthest behind their forecast this month, so you know who to call first.
- Beside it, at risk accounts lists your accounts flagged as quiet or at risk, with how long each has been silent.
- That is your dashboard. Next, your accounts.
The top of the page
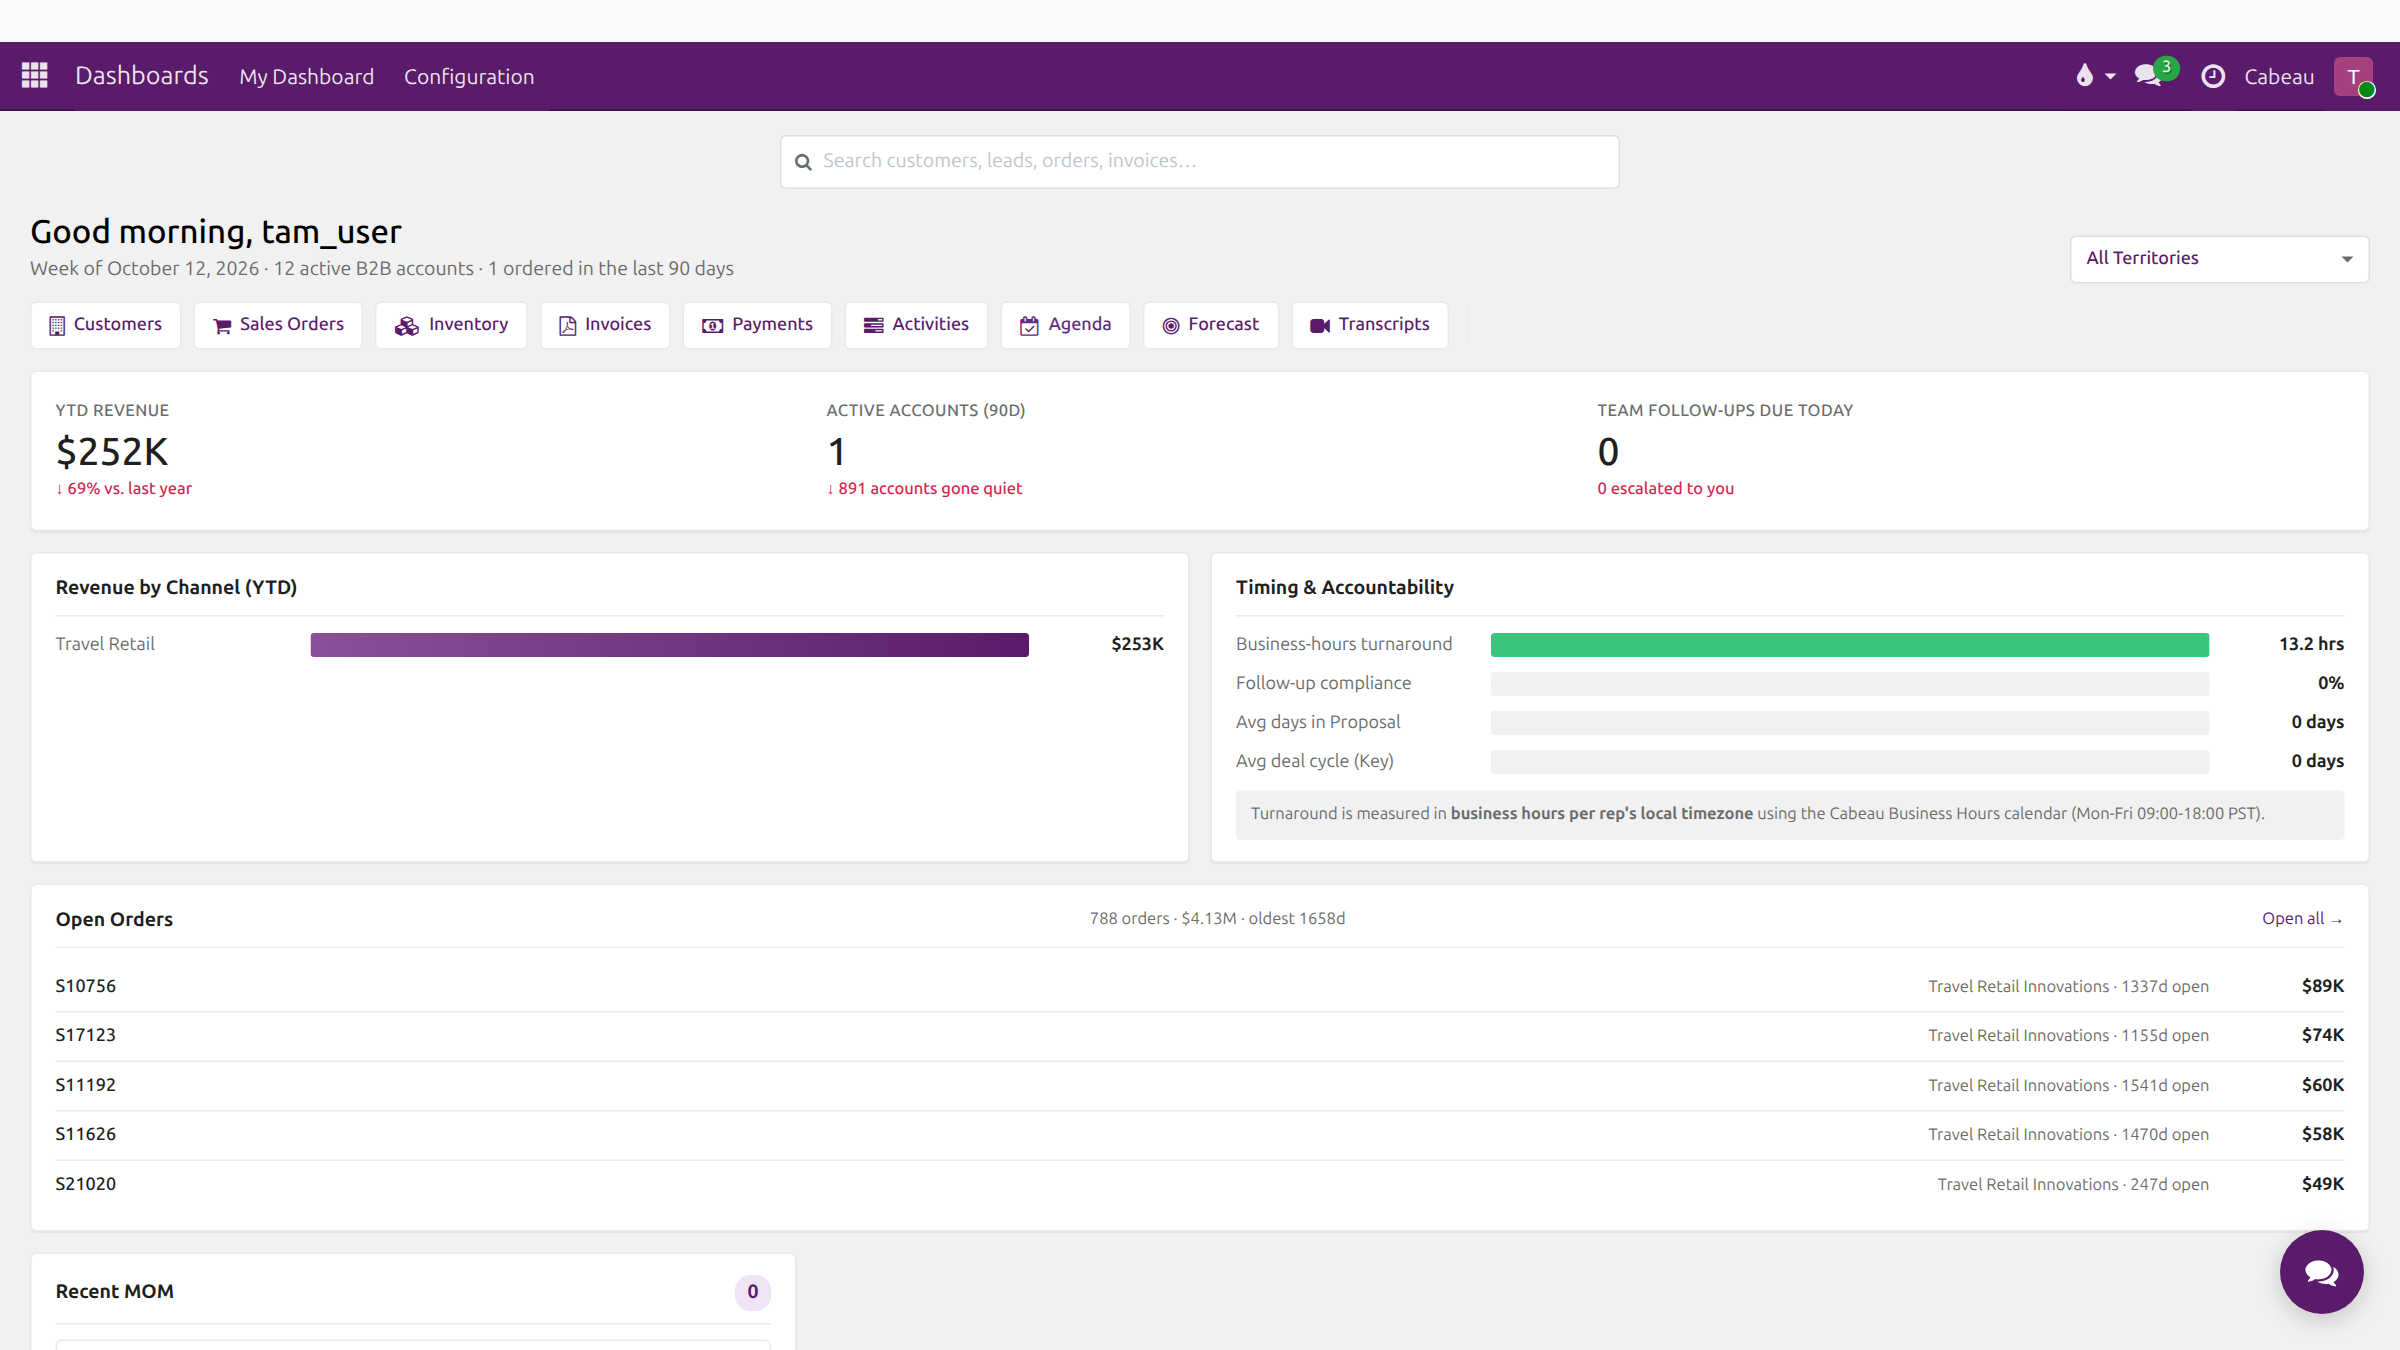
Section titled “The top of the page”- Greeting line: the week, how many active B2B accounts you have, and how many ordered in the last 90 days.
- Search bar: customers, orders and invoices in one box.
- Shortcut row: Customers, Sales Orders, Inventory, Invoices, Payments, Activities, Agenda, Forecast and Transcripts.
- Territory filter: lists only the territories your accounts are in.
Headline numbers
Section titled “Headline numbers”| Tile | What it tells you |
|---|---|
| YTD Revenue | Your accounts’ revenue this year, with the change against last year |
| Active Accounts (90D) | Your accounts that ordered in the last 90 days, and how many have gone quiet |
| Team Follow-ups Due Today | Follow-ups due today, and how many were escalated to you |
Panels
Section titled “Panels”- Revenue by Channel (YTD) and Timing and Accountability, as for the rest of the team.
- Open Orders: your five largest open orders; Open all lists the rest.
- Recent MOM: meetings summarised by the Hub.
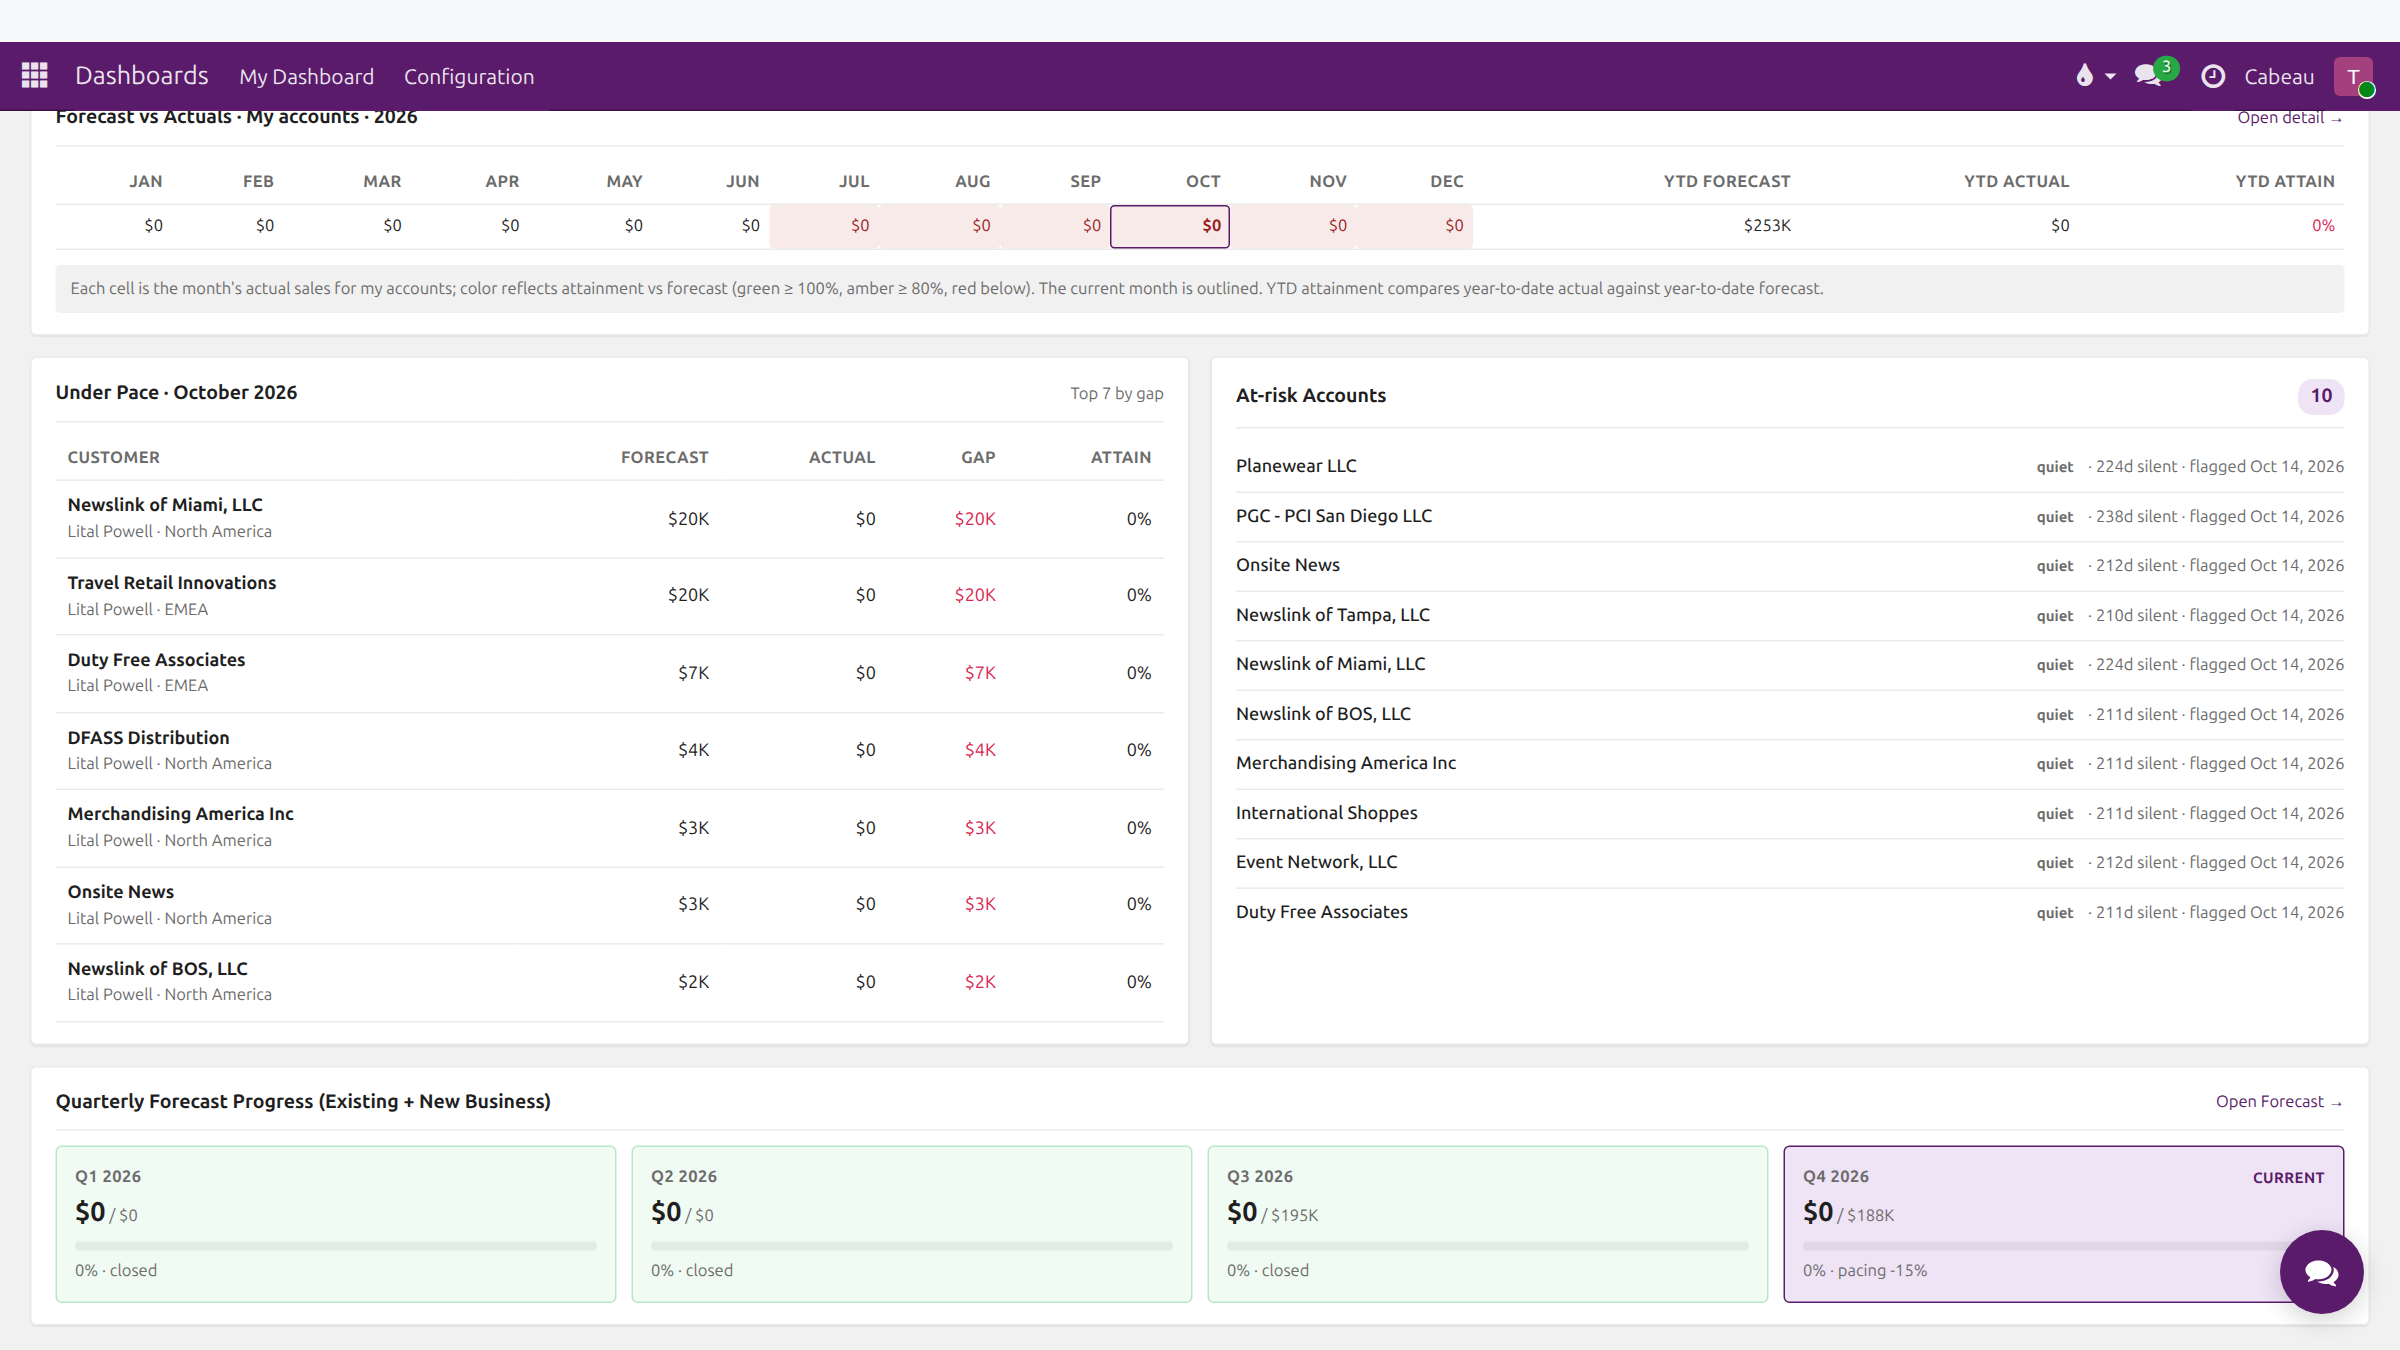
- Forecast vs Actuals: your year by month, green at or above 100 per cent of forecast, amber 80 to 99, red below. The current month is outlined.
- Under Pace: your accounts furthest behind forecast this month, with forecast, actual, gap and attainment.
- At-risk Accounts: accounts that have gone quiet, with how many days since they last ordered and when they were flagged. Start your outreach here.
- Quarterly Forecast Progress: existing and new business against forecast for each quarter.