Reporting
Building your own reports
Section titled “Building your own reports”Any list in the Hub is a report you can shape and export. The VP’s lists cover the whole team; reps see their own.
- Filter and Group By from the search options. Save a view you will reuse under Favorites > Save current search.
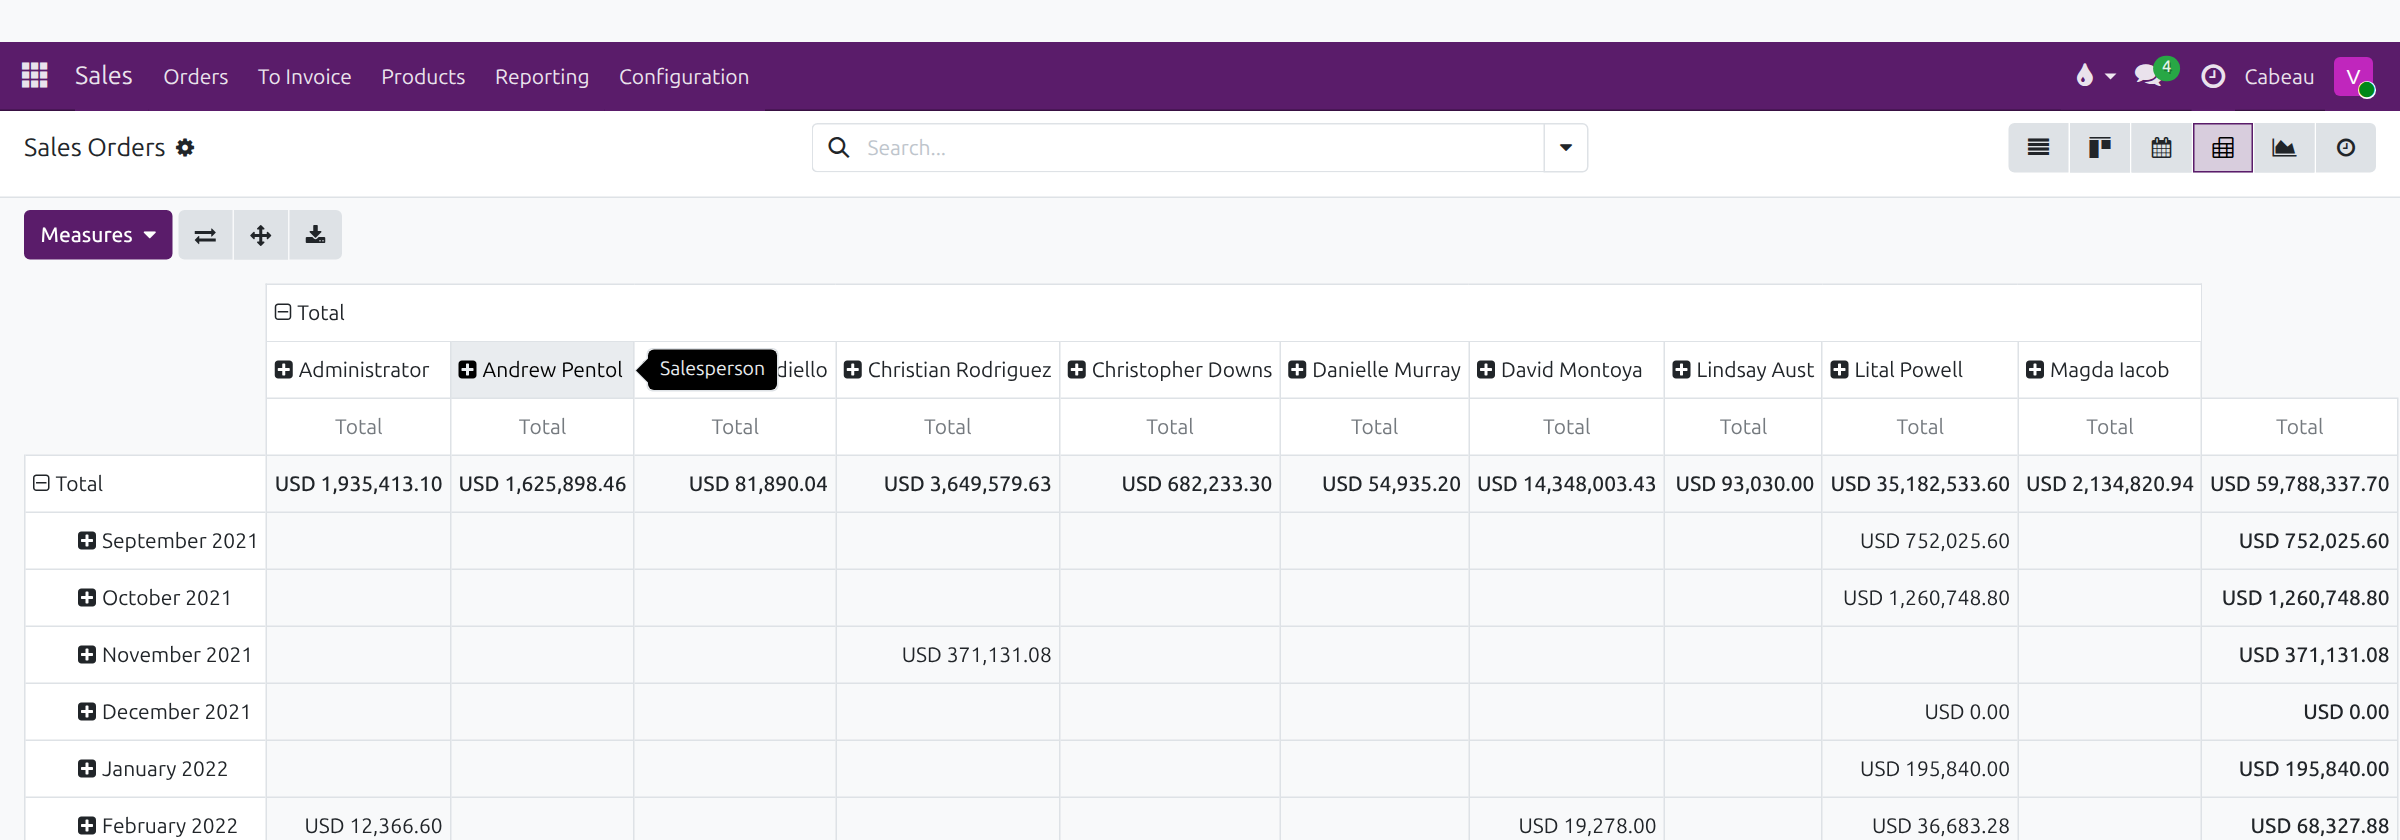
- Switch to the pivot view for totals: choose Measures, expand the headers, flip the axes, and Download xlsx.
- Or tick the rows (or Select all), choose Actions > Export, pick the columns, and export as XLSX or CSV.
This is the way to get raw data out of the Hub, for example sales, units and amounts by account.
Transcript
- This video shows how to turn any list in the Hub into your own report, and take it to Excel.
- Every list has a search bar. The arrow beside it opens filters, group by options and saved favorites.
- Group by Salesperson to see each rep's orders, with a total for every group.
- Switch to the pivot view to cross the figures, for example salesperson against month.
- Measures chooses the figures. Click any header to break it down further. The download button exports the table to Excel.
- Back in the list, select the rows you want, or all of them with the box at the top.
- Then choose Actions, Export. Pick the columns you need, including Channel, and export to Excel or CSV.
- Save your column choice as a template to reuse it next time. Here we close without exporting.
- That is how to build and export your own report.
Dashboard widgets and drill-down
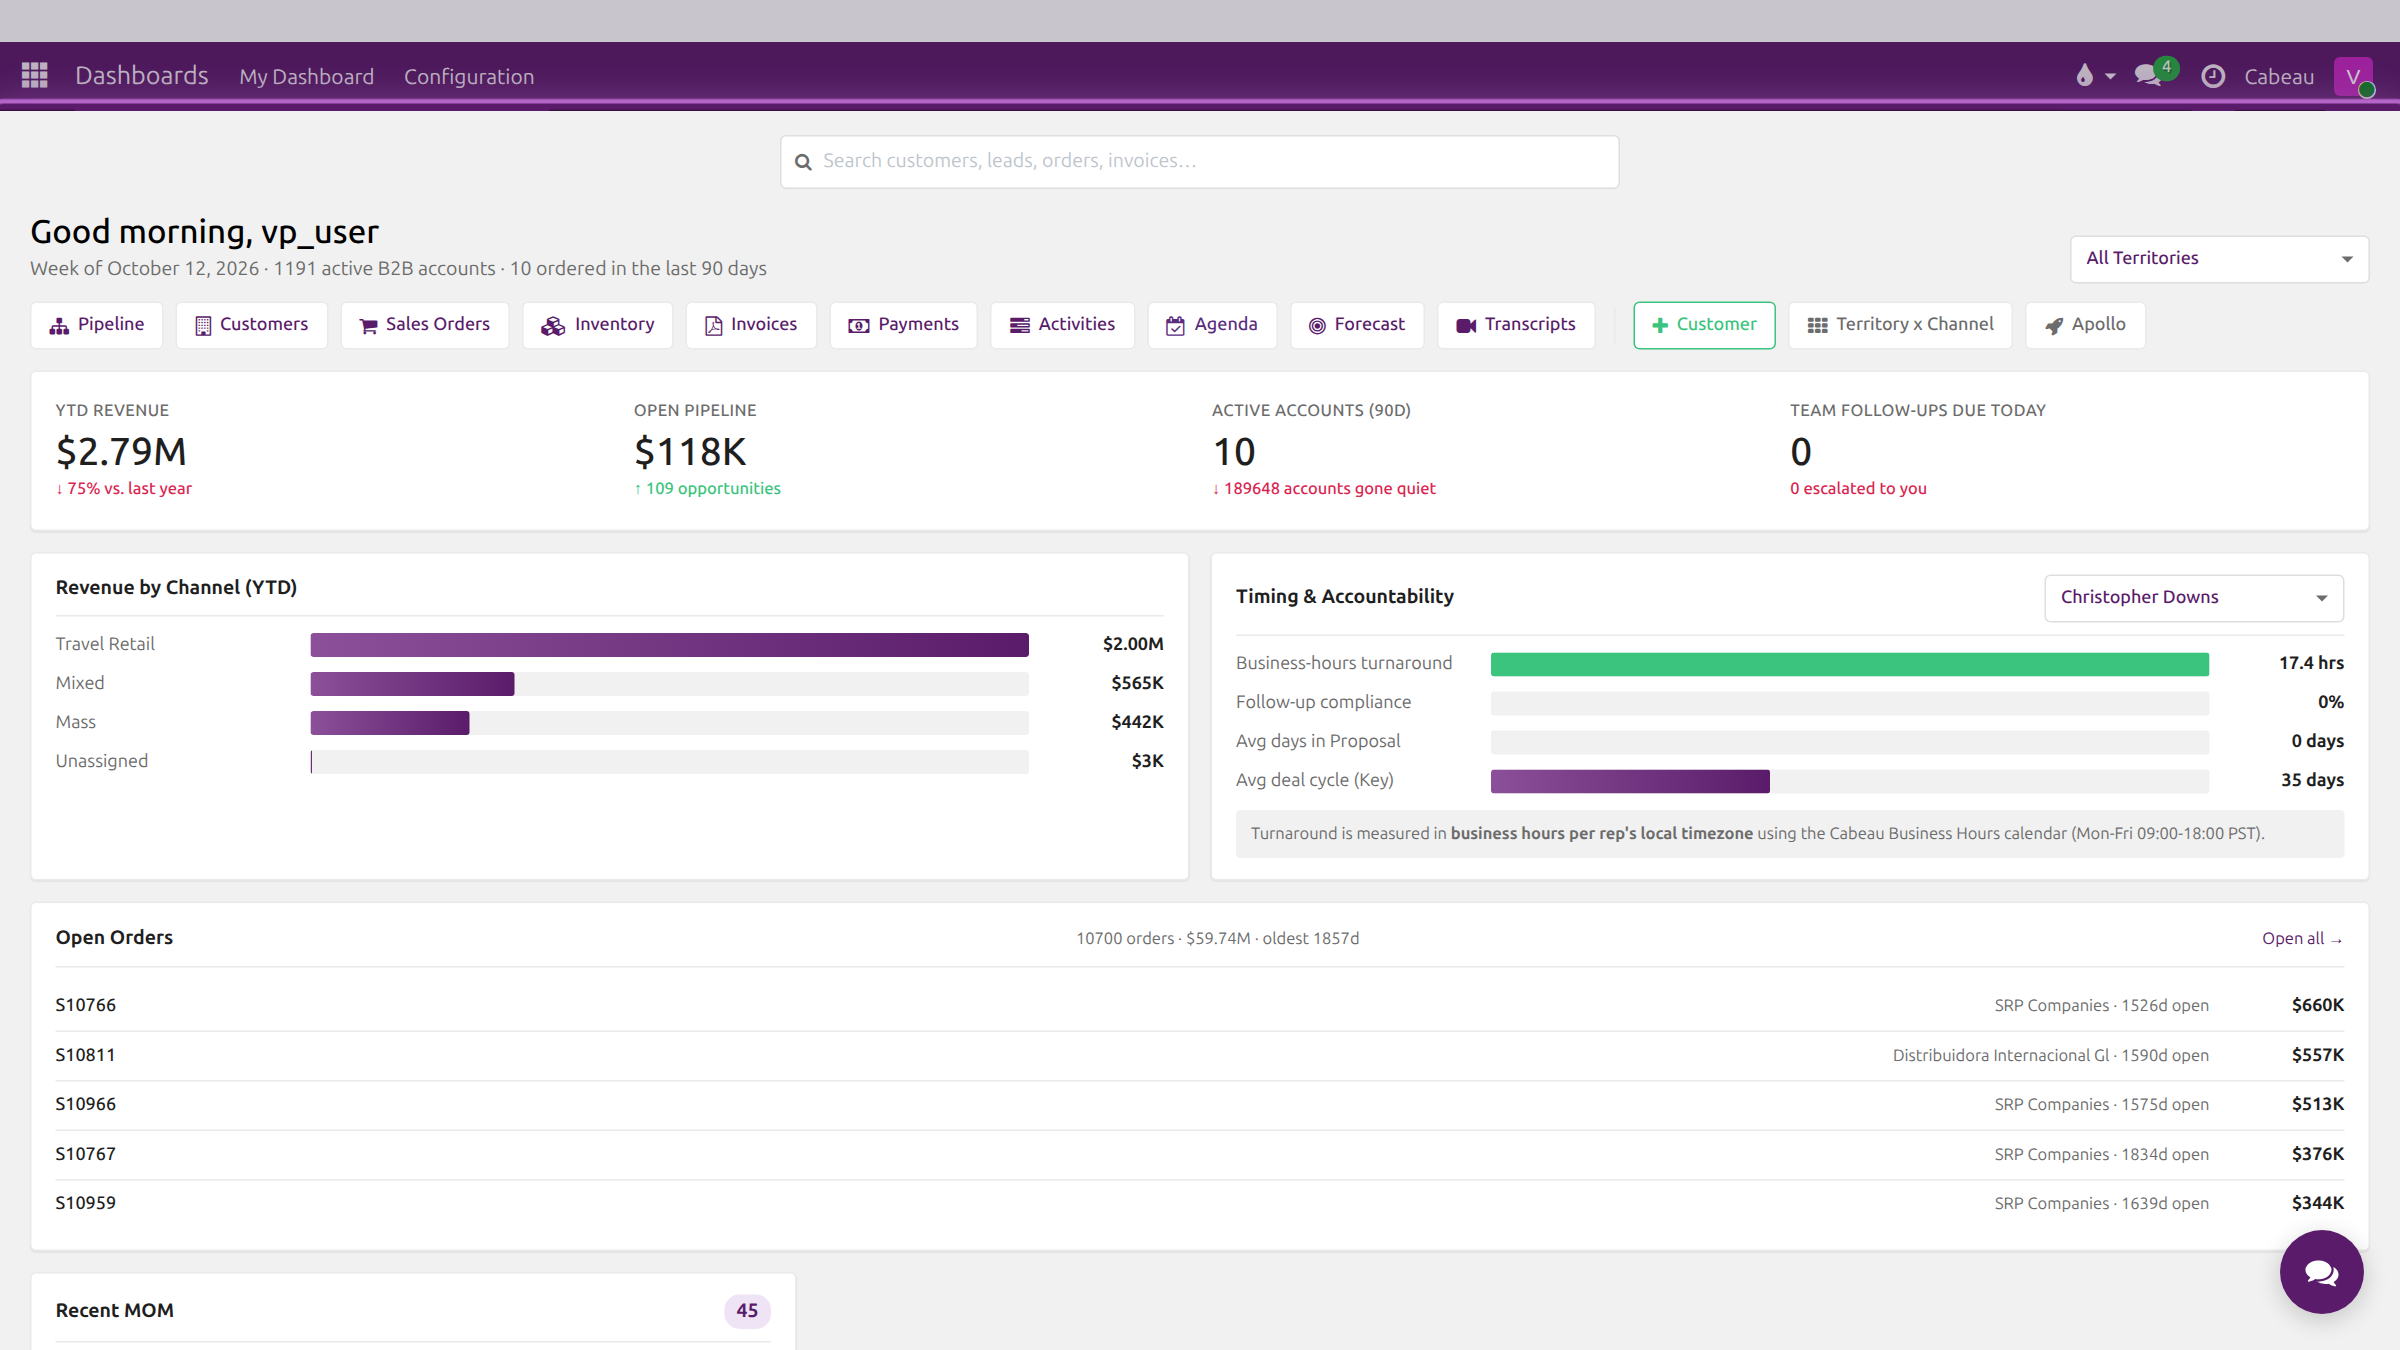
Section titled “Dashboard widgets and drill-down”Every number on the dashboard opens the records behind it.
| Click | Opens |
|---|---|
| YTD Revenue | This year’s invoices |
| Open Pipeline | Open opportunities |
| Active Accounts | The active customers |
| A Revenue by Channel bar | That channel’s orders this year |
| Open Orders > Open all | Every open order |
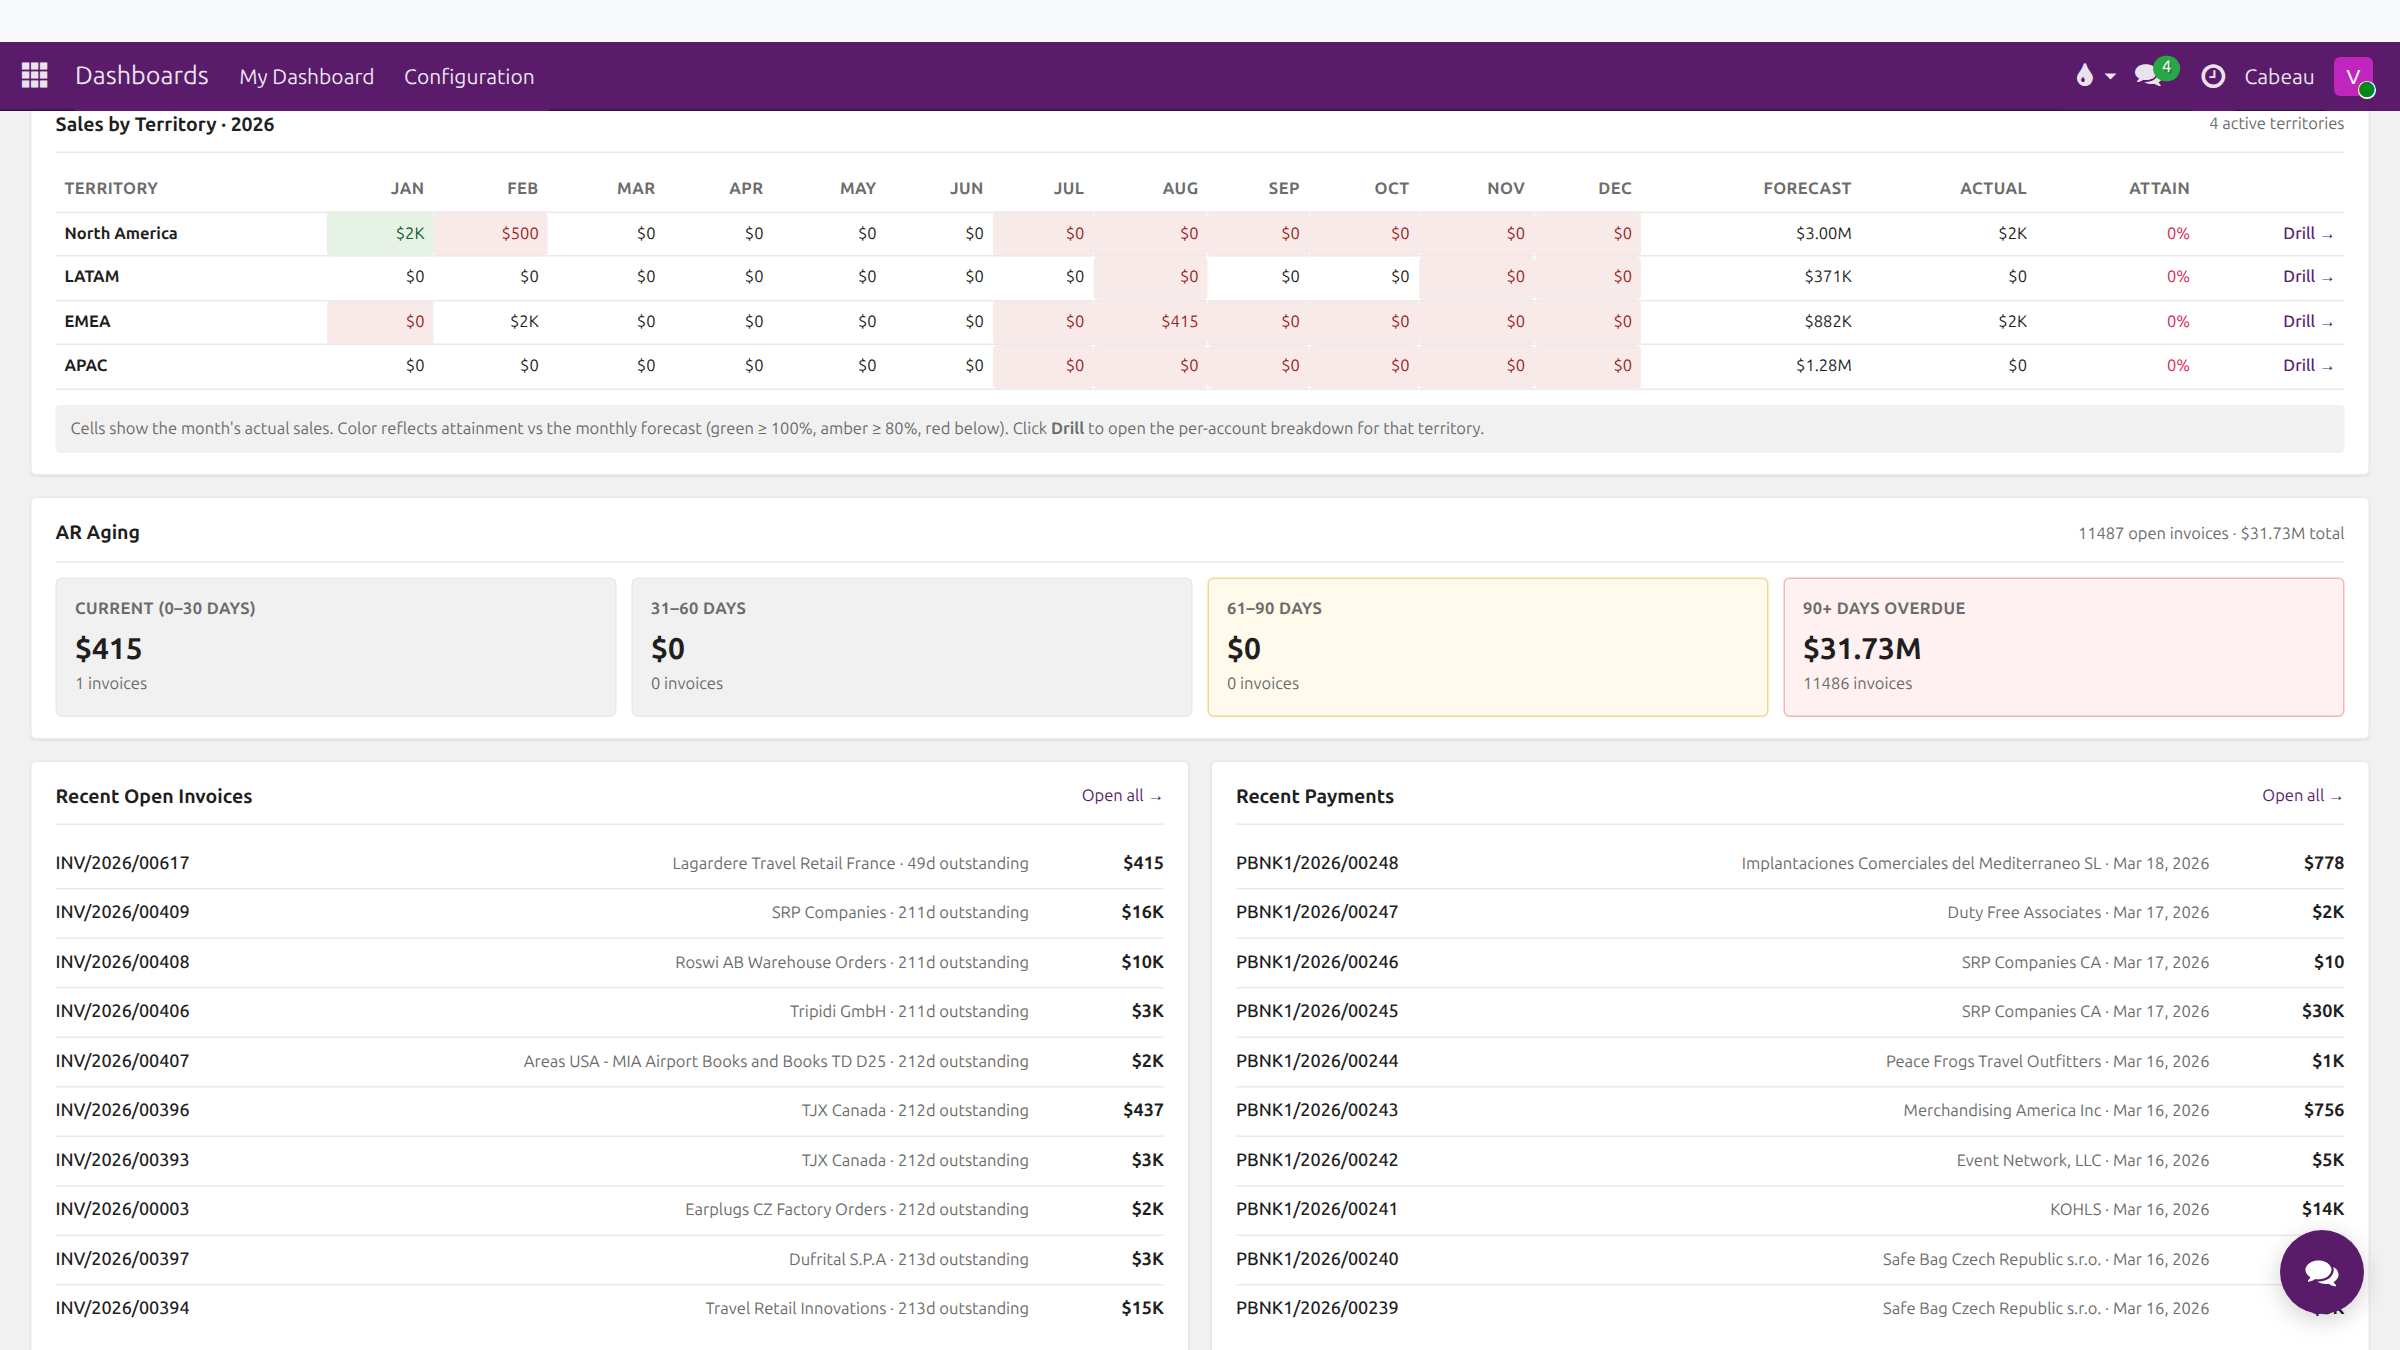
| Sales by Territory > Drill | The forecast sheet for that territory, account by account |
| Recent Open Invoices, Recent Payments > Open all | Open invoices, customer payments |
The VP dashboard also shows AR Aging and Top Unpaid Customers. The breadcrumb takes you back to the dashboard.
Transcript
- This video shows how to click through any figure on your dashboard to the records behind it.
- Each headline tile opens its detail. Year to date revenue opens this year's invoices.
- Open Pipeline opens the opportunities, Active Accounts the customers, and Team Follow-ups the tasks due today.
- Click a channel in Revenue by Channel to see that channel's orders for the year.
- Open all on Open Orders lists every open order. Open detail and Drill open the forecast sheet, to compare forecast with actual sales.
- The breadcrumb at the top always brings you back to the dashboard.
- That is how to drill into your dashboard.
Timing and accountability dashboard
Section titled “Timing and accountability dashboard”Timing and Accountability on the dashboard shows business-hours turnaround, follow-up compliance, average days in Proposal and average deal cycle. The VP picks a rep from the selector to see their numbers.
Transcript
- This video shows how you track the team's response times, and how reminders and escalations are set.
- Timing and Accountability on your dashboard shows how quickly the team responds.
- Pick a rep to see their own numbers.
- Turnaround is measured in business hours, in the rep's own timezone. Follow-up compliance and deal timings sit beside it.
- Reply escalation chases customer emails that nobody has answered. Open Cabeau Tools, Reply Escalation, Escalation Config.
- The master switch turns it on for the whole team.
- Timing sets the reminder to the rep, after twenty four hours, and the escalation, after two days.
- Routing names who receives the escalation. Discard closes the settings without changes.
- That is how response times, reminders and escalations fit together.